Case Study
OBJECTIVE: The electronics industry frequently evaluates the reliability of EMI shielding performance by subjecting materials to various thermal and mechanical stresses. Electrical measurements are made before and after these stresses to determine the level of change. The electrical performance of XGR Technologies SnapShot EMI Shields was evaluated before and after the following types of stress conditions:
Mechanical Shock: JEDEC Standard JESD22-B104-B
Thermal Shock: MIL Spec 883E-1010.7B - 10 cycles
Bump and Vibration: IEC-68-2-29 and IEC-68-2-64

Test Method Description
In addition to evaluating the effect of thermal and mechanical stresses on shielding performance, the electronics industry often evaluates the reliability performance of EMI shield materials by aging materials through various combinations of time, temperature, and relative humidity. This type of testing is commonly called Accelerated Life Testing or ALT. Electrical measurements are made before and after aging to assess the level of property change. In one test protocol, SnapShot shielding materials were aged at 85°C / 85% RH (Relative Humidity) for 5 days, and the resulting DC resistance was measured*. This test regime has been found to be effective in screening EMI shielding materials for wireless devices. Such high temperature and humidity conditions promote physical and, perhaps, chemical degradation processes in these materials.
The XGR SnapShot EMI Shield snaps onto the PCB via a patented attachment mechanism utilizing individual solder spheres as snap features. The solder spheres are placed along the perimeter of each cavity and electrical contact is made at each ball location between the inner and outer wall of the can. DC resistance can be evaluated at each ball location of an installed can using the Triple Can Resistance Test*. This test method was used to evaluate the electrical performance of the XGR SnapShot EMI Shield before and after each stress condition and before and after ALT.
DC resistance was measured before and after mechanical shock, thermal shock, vibration and ALT using the Triple Can Resistance Test. The purpose of this test is to evaluate the electrical contact between the thermoformed part and the standard BGA balls that provide the electrical and mechanical connection.
The test uses a standard configuration known as the “Triple Can” design. The thermoformed Triple Can is installed to a PC board with 87 BGA balls mounted (Figure A). The test board is then placed into a fixture, which allows for a 4-point probe DC resistance measurement at each of the 87 contact pads (Figure B).


A Keithly ohm-meter and multiplexer measure and record the resistance from the top of the part, through the BGA ball and to the contact pad. This test simulates the contact between the thermoformed part and the BGA ball and results should be similar to what is to be expected on a final product.
Mechanical Shock Results
The DC resistance was measured before and after mechanical shock. Mechanical shock was performed according to JEDEC test method JESD22-B104-B. Each sample was subjected to five shock pulses of the peak (g) level in each of the orientations X1, X2, Y1,Y2, Z1, Z2, for a total of 30 shocks. Chart 1 and Table 1 show the average DC resistance results before and after thermal shock. The average was taken from a sample of 6 cans tested. The mechanical shock had little effect on the electrical contact between the BGA balls and the shield. The average DC resistance after impact was 0.036 ohms with a pooled standard deviation of 0.0122 ohms.
CHART 1: Triple can average DC resistance before and after Mechanical Shock.

TABLE 1: Mechanical Shock Data Summary
|
||||||
|---|---|---|---|---|---|---|
| Average DC Resistance over all Ball Locations (ohms) | 0.0357 | 0.0362 | ||||
| Pooled Standard Deviation of all Ball Locations (ohms) | 0.0121 | 0.0122 | ||||
Thermal Shock Results
Thermal shock testing was carried out according to the conditions specified in Mil Spec 883 - 1010.7 B for 10 cycles. This method cycles between -55°C and 125°C, holding at each temperature for 10 minutes. DC results before and after shock are shown in Chart 2 and Table 2. All ball locations remained below 0.100 ohms after thermal shock with an average DC resistance of 0.038 ohms. A total of 10 cans were tested as part of this study.
CHART 2: Triple can average DC resistance before and after Thermal Shock.

TABLE 2: Thermal Shock Data Summary
|
||||||
|---|---|---|---|---|---|---|
| Average DC Resistance over all Ball Locations (ohms) | 0.0358 | 0.0378 | ||||
| Pooled Standard Deviation of all Ball Locations (ohms) | 0.0111 | 0.0197 | ||||
Vibration Results
A sample set of 20 triple cans were subjected to bump and vibration conditions according to test standards IEC 68-2-29 and IEC 68-2-64 respectively. Bump and vibration testing occurred in sequence on all boards. The triple cans were bolted to a test plate, which was fixed to a vibration drum. The vibration drum can apply vibration pulses in the X, Y, and Z directions. Details on the bump and vibration test parameters are shown in Tables 3 and 4 below.
TABLE 3: Bump Test Parameters from IEC 68-2-29
| IEC 68-2-29 Bump Test Parameter | Value |
|---|---|
| Magnitude | 10g |
| Duration | 16 milliseconds |
| Shape | 1/2 sine-wave |
| No. of Directions | 6 (X+,X-, Y+,Y-,Z+,Z-) |
| No. of Shocks per direction | 1000 |
| Total no. of Shocks | 6000 |
TABLE 3: Bump Test Parameters from IEC 68-2-29
| IEC 68-2-64 Random Vibration Test Parameter | Value |
|---|---|
| Stage 1 : Frequency (Hz) | 10 - 200 |
| Stage 1: Vibration Level (g2/ Hz) | 0.03 |
| Stage 2: Frequency (Hz) | 20- 2000 |
| Stage 2: Vibration Level (g2/ Hz) | 0.01 |
| Duration | 20 minutes/ Axis (X,Y,Z) |
DC resistance was measured on all boards before and after testing. The average results are shown in Chart 3 and Table 5. As seen with earlier results, the DC resistance was insensitive to the bump and vibration stress.
CHART 3: Triple can average DC resistance before and after Vibration Testing.

TABLE 5: Bump and Vibration Data Summary
|
||||||
|---|---|---|---|---|---|---|
| Average DC Resistance over all Ball Locations (ohms) | 0.0426 | 0.0419 | ||||
| Pooled Standard Deviation of all Ball Locations (ohms) | 0.0143 | 0.0116 | ||||
Accelerated life testing results
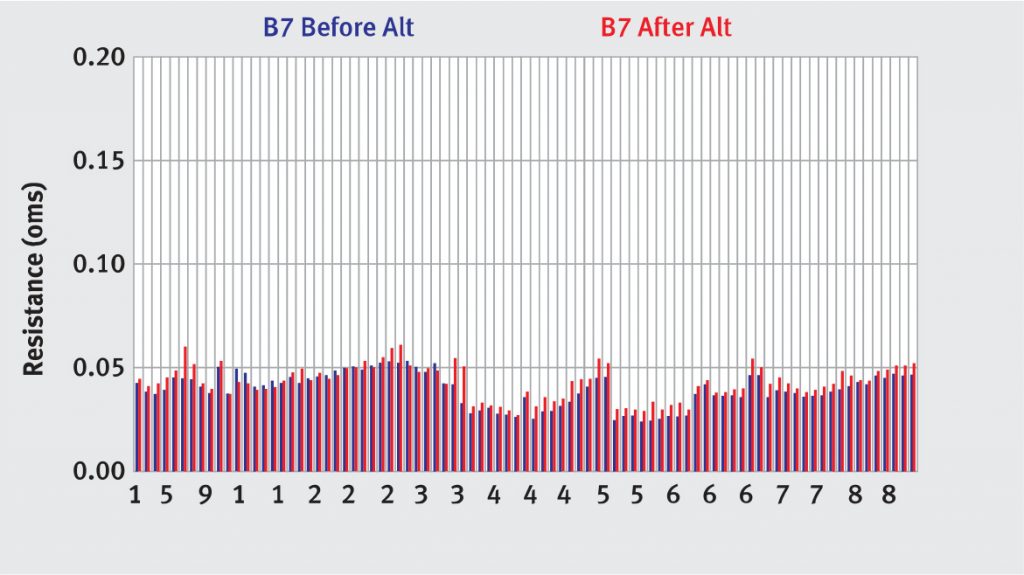
DC resistance was measured before and after Accelerated Life Testing. Samples were aged at 85°C / 85% RH (Relative Humidity) for 5 days. Chart 4 shows the results. The resistance of each sphere is shown as a blue line/ red line pair. The blue line shows resistance prior to ALT and the red line shows resistance after ALT.
CHART 4: Triple can average DC resistance before and after ALT.
Conclusion
The XGR™ Technologies SnapShot® EMI Shields showed minimal change in electrical performance after mechanical shock, thermal shock, vibration testing and Accelerated Life Testing.